FPG Smart Money Indicator
Let me introduce you to our all-in-one indicator, which is designed to provide traders with real-time insights into market structure and key price action methodologies. Our indicator offers a comprehensive suite of features, including swing BOS/CHoCH, internal BOS/CHoCH, order blocks, premium and discount zones, equal highs and lows, and much more.
One of the most valuable features of our indicator is its ability to help traders identify where institutional market participants have placed their buy and sell orders, allowing traders to make more informed trading decisions. We refer to this as the “Smart Money Concept” (SMC), which is a widely used approach amongst price action traders looking for more optimal points of interest in the market.
In addition to providing real-time market insights, our indicator also includes alerts for the presence of swing structures and other relevant conditions. This means that traders can receive notifications when key price action events occur, helping them to take advantage of trading opportunities as they arise. So if you’re looking for an all-in-one indicator that can help you navigate market liquidity and make more informed trading decisions, look no further than our Smart Money Concept Indicator.
Features
This indicator includes many features relevant to SMC, these are highlighted below:
- Full internal & swing market structure labeling in real-time
- Break of Structure (BOS)
- Change of Character (CHoCH)
- Order Blocks (bullish & bearish)
- Equal Highs & Lows
- Fair Value Gap Detection
- Previous Highs & Lows
- Premium & Discount Zones as a range
- Options to style the indicator to more easily display these concepts
Settings
- Mode: Allows the user to select Historical (default) or Present, which displays only recent data on the chart.
- Style: Allows the user to select different styling for the entire indicator between Colored (default) and Monochrome.
- Color Candles: Plots candles based on the internal & swing structures from within the indicator on the chart.
- Internal Structure: Displays the internal structure labels & dashed lines to represent them. (BOS & CHoCH).
- Confluence Filter: Filter non-significant internal structure breakouts.
- Swing Structure: Displays the swing structure labels & solid lines on the chart (larger BOS & CHoCH labels).
- Swing Points: Displays swing points labels on charts such as HH, HL, LH, LL.
- Internal Order Blocks: Enables Internal Order Blocks & allows the user to select how many most recent Internal Order Blocks appear on the chart.
- Swing Order Blocks: Enables Swing Order Blocks & allows the user to select how many most recent Swing Order Blocks appear on the chart.
- Equal Highs & Lows: Displays EQH/EQL labels on chart for detecting equal highs & lows.
- Bars Confirmation: Allows the user to select how many bars are needed to confirm an EQH/EQL symbol on a chart.
- Fair Value Gaps: Displays boxes to highlight imbalance areas on the chart.
- Auto Threshold: Filter out non-significant fair value gaps.
- Timeframe: Allows the user to select the timeframe for the Fair Value Gap detection.
- Extend FVG: Allows the user to choose how many bars to extend the Fair Value Gap boxes on the chart.
- Highs & Lows MTF: Allows the user to display previous highs & lows from daily, weekly, & monthly timeframes as significant levels.
- Premium/Discount Zones: Allows the user to display Premium, Discount, and Equilibrium zones on the chart
USAGE
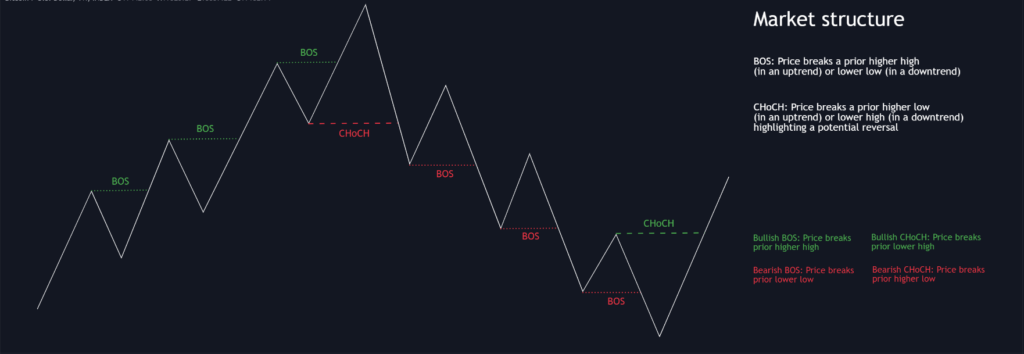
Users can see automatic CHoCH and BOS labels to highlight breakouts of market structure, which allows to determine the market trend. In the chart below we can see the internal structure which displays more frequent labels within larger structures. We can also see equal highs & lows (EQH/EQL) labels plotted alongside the internal structure to frequently give indications of potential reversals.
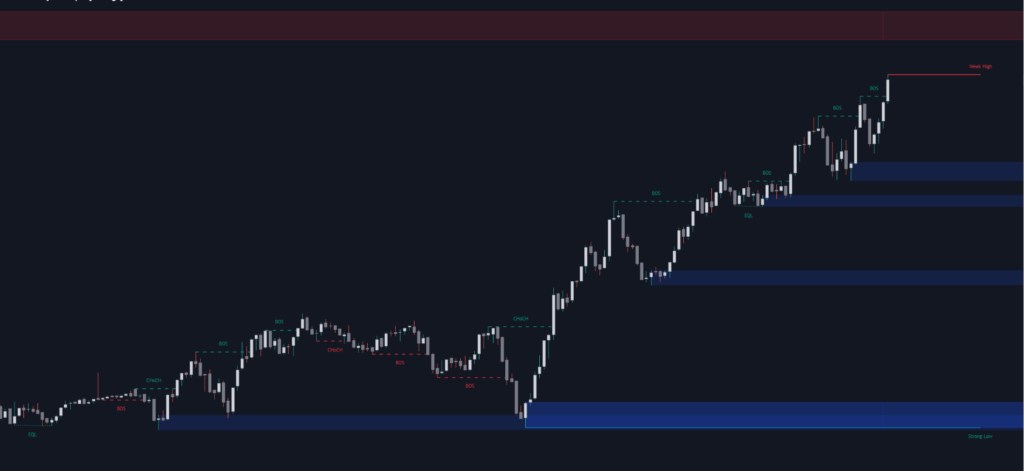
In the chart below we can see the swing market structure labels. These are also labeled as BOS and CHoCH but with a solid line & larger text to show larger market structure breakouts & trend reversals. Users can be mindful of these larger structure labels while trading internal structures as displayed in the previous chart.
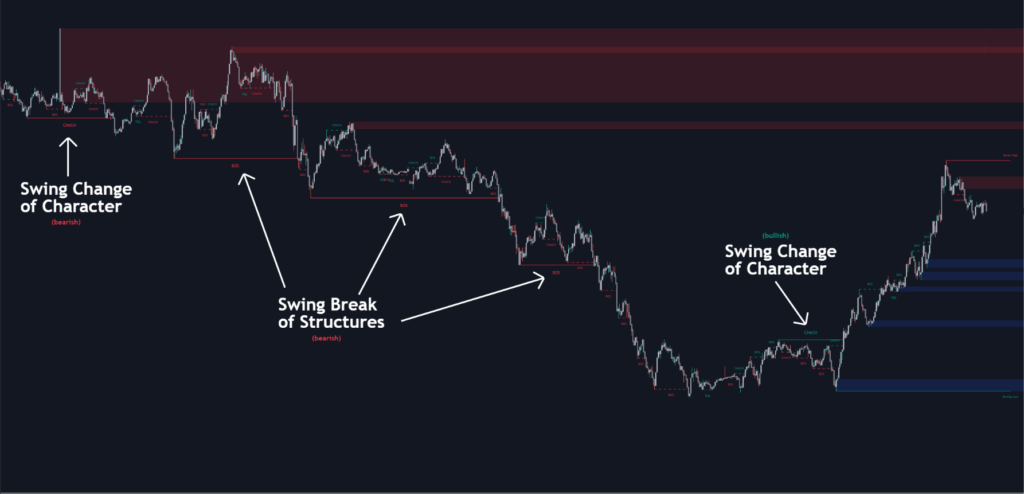
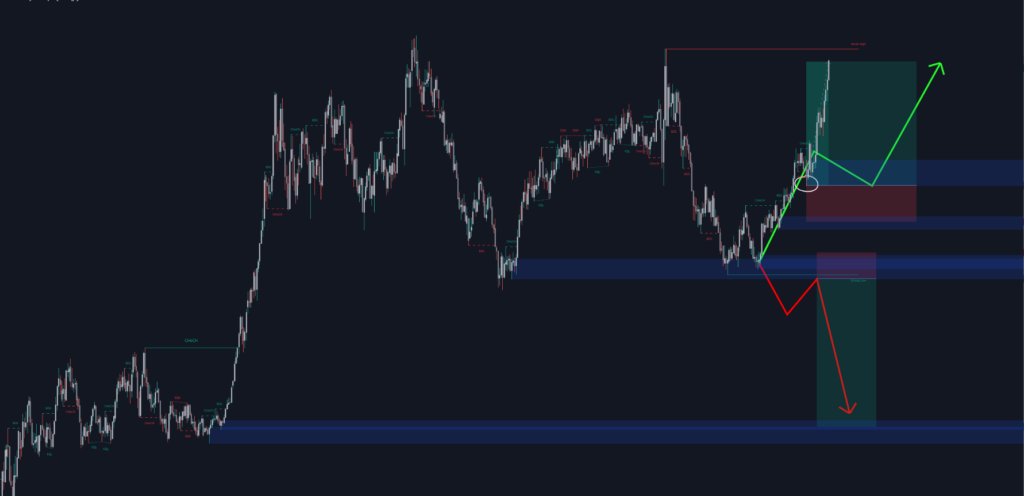
Order blocks highlight areas where institutional market participants open positions, one can use order blocks to determine confirmation entries or potential targets as we can expect there is a large amount of liquidity at these order blocks. In the chart below we can see 2 potential trade setups with confirmation entries. The path outlined in red would be a potential short entry targeting the blue order block below, and the path outlined in green would be a potential long entry, targeting the red order blocks above.
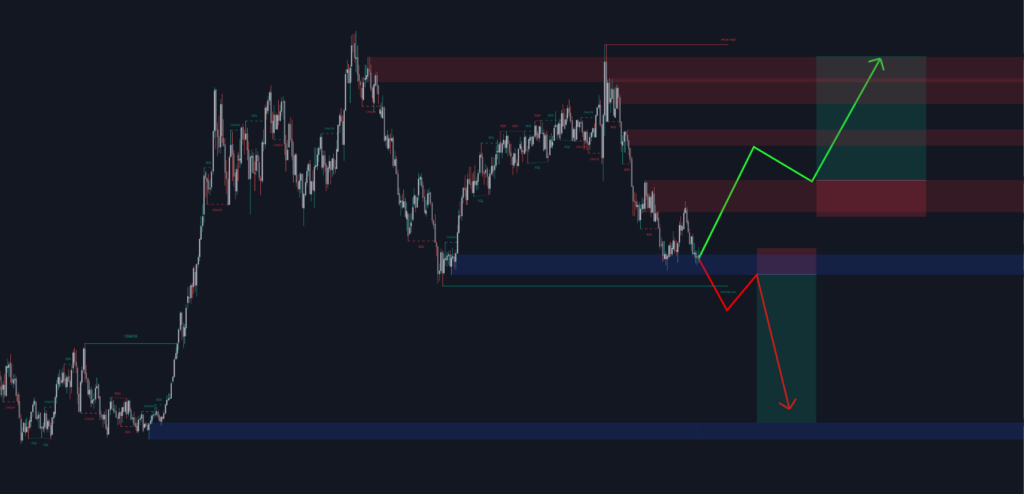
As we can see in the chart below, the bullish confirmation entry played out in this scenario with the green path outlined in hindsight. As price breaks though the order blocks above, the indicator will consider them mitigated causing them to disappear, and as per the logic of these order blocks they will always display 5 (by default) on the chart so we can now see more actionable levels.
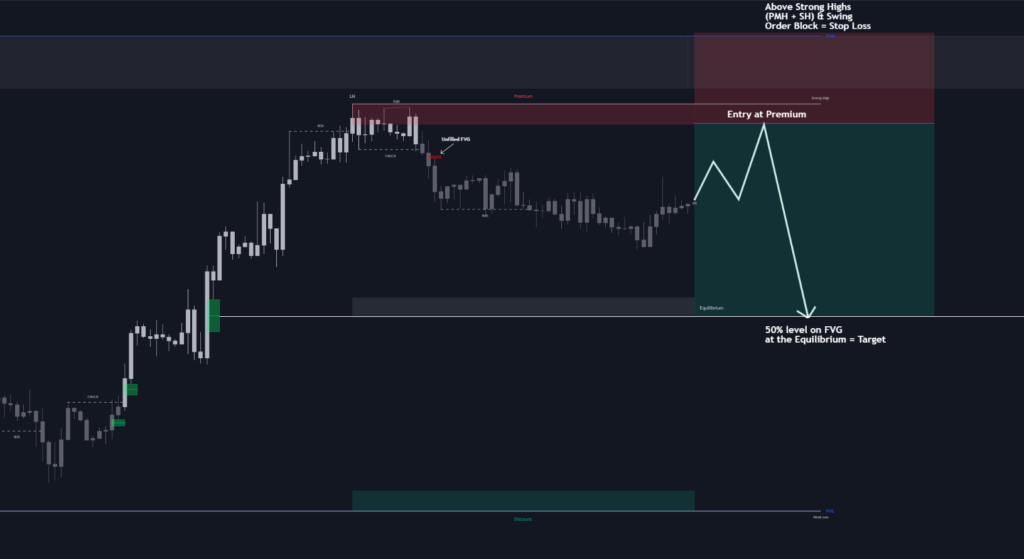
The Smart Money Concepts indicator has many other features and here we can see how they can also help a user find potential levels for price action trading. In the screenshot below we can see a trade setup using the Previous Monthly High, Strong High, and a Swing Order Block as a stop loss. Accompanied by the Premium from the Discount/Premium zones feature being used as a potential entry. A potential take profit level for this trade setup that a user could easily identify would be the 50% mark labeled with the Fair Value Gap & the Equilibrium all displayed automatically by the indicator.
This indicator highlights all relevant components of Smart Money Concepts which can be a very useful interpretation of market structure, liquidity, & more simply put, price action. The term was coined & popularized primarily within the forex community & by ICT while making its way to become a part of many traders’ analysis. These concepts, with or without this indicator do not guarantee a trader to be trading within the presence of institutional or “bank-level” liquidity, there is no supporting data regarding the validity of these teachings.
“Disclaimer: The information and opinions contained in this website are for general information purposes only. The information is provided by Futurespg.com and while we endeavor to keep the information up-to-date and correct, we make no representations or warranties of any kind, express or implied, about the completeness, accuracy, reliability, suitability or availability with respect to the website or the information, products, services, or related graphics contained in the website for any purpose. Any reliance you place on such information is therefore strictly at your own risk.
In no event will we be liable for any loss or damage including without limitation, indirect or consequential loss or damage, or any loss or damage whatsoever arising from loss of data or profits arising out of, or in connection with, the use of this website.
Futures trading involves significant risk of loss and is not suitable for all investors. You should carefully consider your investment objectives, level of experience, and risk appetite before making any investment decisions. The possibility exists that you could sustain a loss of some or all of your initial investment and therefore you should not invest money that you cannot afford to lose. You should be aware of all the risks associated with futures trading, and seek advice from an independent financial advisor if you have any doubts.
The information contained in this website is not necessarily provided in real-time nor is it necessarily accurate. The opinions expressed in this website do not constitute investment advice and independent advice should be sought where appropriate.
This website may include advertisements and other promotional contents, and Futurespg.com may receive compensation for any products or services you purchase as a result of clicking on a link to a third-party website.
Futurespg.com does not endorse or take responsibility for any third-party content, products, or services and is not responsible for any loss or damage that may arise from your use of them.
By accessing this website, you agree to be bound by the terms and conditions set forth above.”
“NinjaTrader® is a registered trademark of NinjaTrader Group, LLC. No NinjaTrader
company has any affiliation with the owner, developer, or provider of the products or
services described herein, or any interest, ownership or otherwise, in any such product or
service, or endorses, recommends or approves any such product or service.”
Hypothetical performance results have many inherent limitations, some of which are described below.
No representation is being made that any account will or is likely to achieve profits or losses similar to
those shown; in fact, there are frequently sharp differences between hypothetical performance results
and the actual results subsequently achieved by any particular trading program. One of the limitations of
hypothetical performance results is that they are generally prepared with the benefit of hindsight. In
addition, hypothetical trading does not involve financial risk, and no hypothetical trading record can
completely account for the impact of financial risk of actual trading. for example, the ability to withstand
losses or to adhere to a particular trading program in spite of trading losses are material points which
can also adversely affect actual trading results. There are numerous other factors related to the markets
Last updated March 10, 2023
in general or to the implementation of any specific trading program which cannot be fully accounted for
in the preparation of hypothetical performance results and all which can adversely affect trading results
